You’re driving traffic. Campaigns are running. Orders are rolling in, but you can’t distinguish between profitable and unprofitable channels, what customers are doing when they hit the 73% ‘cart abandonment’ rate, or whether your average order value is rising or simply sipping away the margins without you realizing. Sound familiar?
Most online retailers have mountains of data, but act on intuition. Ecommerce analytics is all about bridging that gap between having data and using data to make confident decisions that impact revenue.
A robust ecommerce data analytics stack transforms click streams, transaction data, and customer behavior into a compelling story, a story that lets you know where to spend, what to do, and which growth levers to pull next. The outcome? Reduced customer acquisition costs, improved conversion rates, improved AOV, and a business that won’t guess its way to success.
In this guide, you will learn the key metrics to monitor, the top ecommerce analytics tools for 2026, how to create a workable retail analytics dashboard, and how tools are used to seamlessly embed analytics into marketplace operations.
What is eCommerce Analytics?
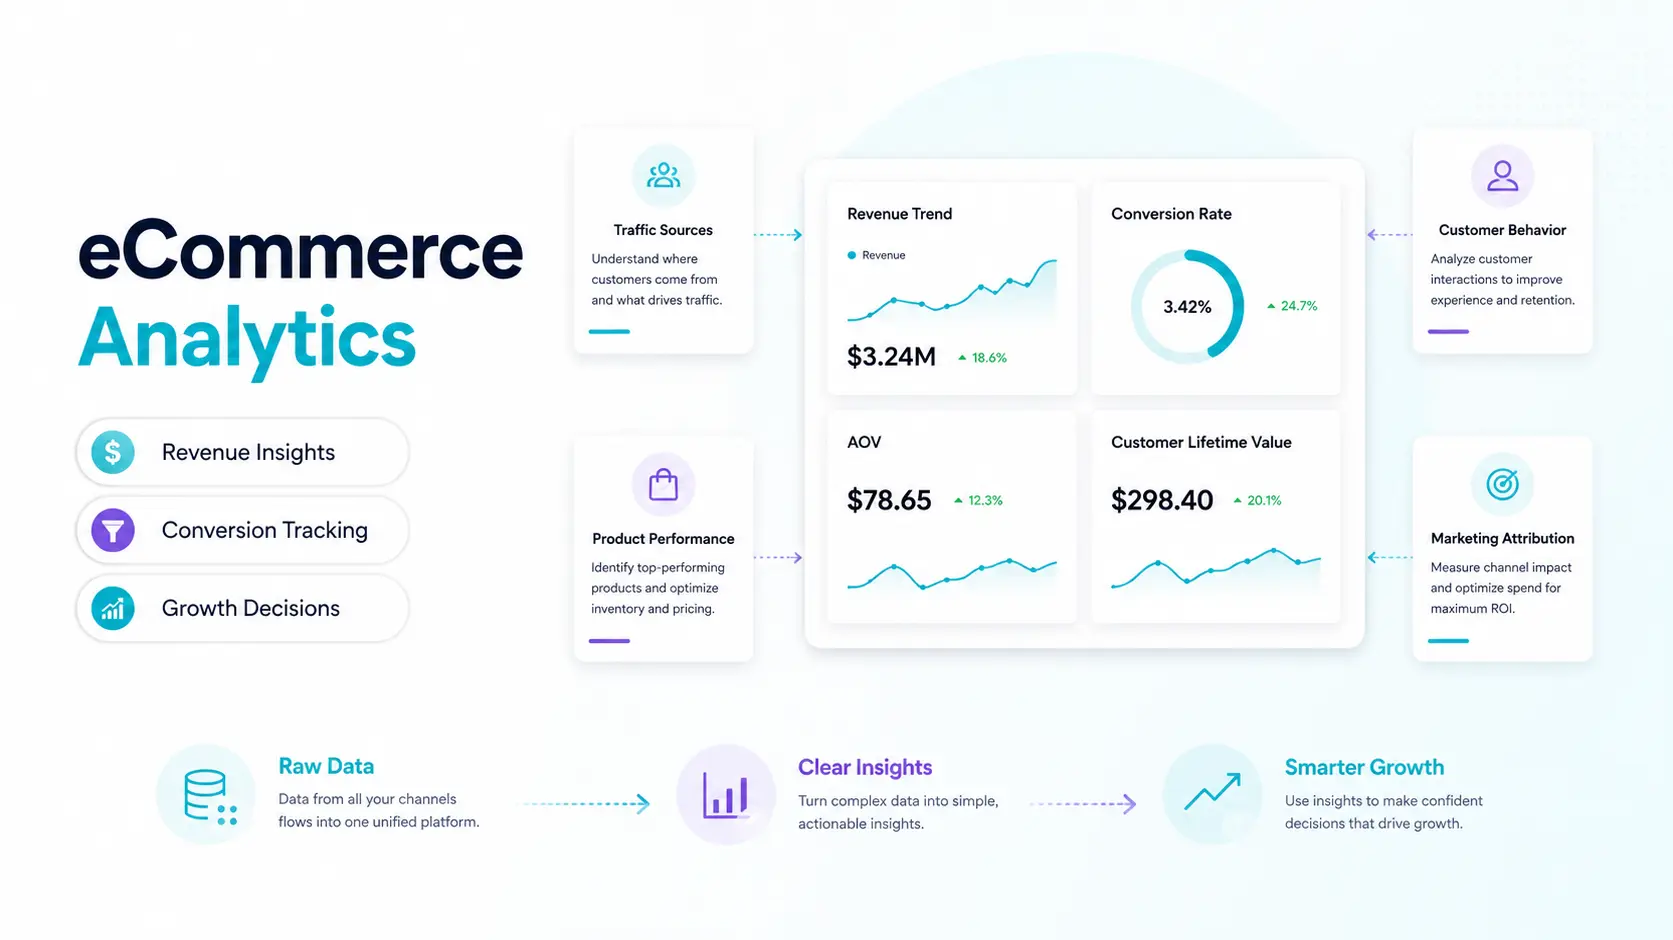
Ecommerce analytics involves gathering, analyzing, and interpreting data from your online business, such as visits to product pages, add-to-cart actions, checkout conversions, and more. It connects business performance and customer’s intention.
Consider it as the brain of your store. Every tap, scroll, search, and purchase is a signal. Analytics platforms translate those signals into actionable insight, answering questions such as: why were revenues down by 18% last Tuesday? Which traffic source is the highest LTV? Once my funnel leaks, at what point?
Ecommerce performance analytics adds transactional data, product performance, customer segmentation, and marketing attribution to basic web analytics (which has pages only) and provides an ecommerce 360° view of your ecommerce commercial engine.
Key eCommerce Metrics to Track
Not every metric will be the same. The ecommerce KPIs that are important are those that directly affect revenue and customer experience. These are the must-haves, broken down by business function:
Acquisition & Traffic Metrics
It measures how users discover, visit, and interact with your website, app, or digital platform. These metrics help evaluate the effectiveness of marketing channels and identify opportunities to increase qualified traffic.
| Metric | Definition | Benchmark / Key Insight |
|---|---|---|
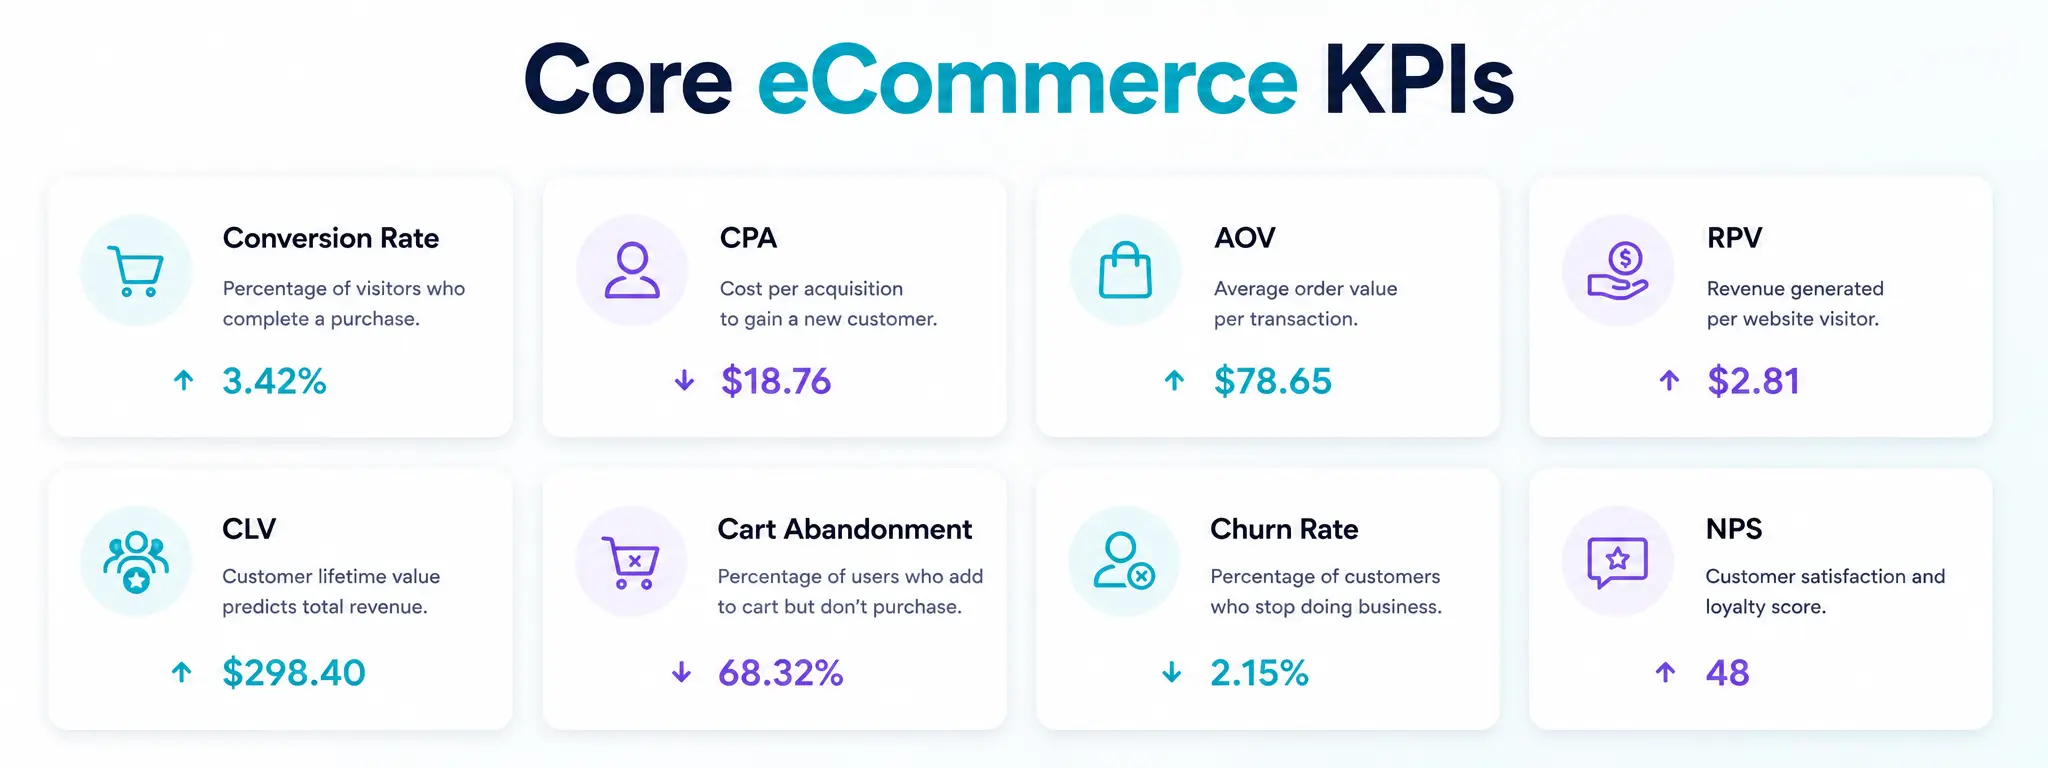
| Conversion Rate (CVR) | Percentage of visitors who complete a purchase. | Industry average: 2–4%. A CVR above 4% is generally considered strong. |
| Cost Per Acquisition (CPA) | The amount spent on advertising to acquire one new customer. Calculated as Ad Spend ÷ New Customers Acquired. | CPA should not exceed Customer Lifetime Value (LTV) to maintain profitability. |
| Traffic by Channel | Breakdown of website traffic sources such as Organic, Paid, Email, Direct, and Referral. | Helps identify which channels drive the most qualified visitors and contribute most effectively to conversions and revenue. |
Revenue & Order Metrics
It measures a business’s financial performance by tracking sales, orders, and customer purchasing behavior. These metrics provide insights into revenue generation, order efficiency, and overall business growth.
| Metric | Definition | Benchmark / Key Insight |
|---|---|---|
| Average Order Value (AOV) | Total revenue divided by the number of orders. | Helps evaluate how much customers spend per purchase. Increasing AOV through upsells, cross-sells, and bundling directly improves revenue efficiency. |
| Revenue Per Visitor (RPV) | Calculated as Conversion Rate (CVR) × Average Order Value (AOV). | A single metric that combines traffic quality and purchase behavior. Useful for assessing overall site monetization performance. |
| Cart Abandonment Rate | Percentage of users who add items to cart but do not complete checkout. | The industry average is around ~70%. Even a 5% reduction can significantly boost monthly revenue, given high purchase intent at this stage. |
Customer Metrics
It measures customer acquisition, engagement, retention, and overall value to the business. These metrics help organizations understand customer behavior, improve satisfaction, and drive long-term growth.
| Metric | Definition | Benchmark / Key Insight |
|---|---|---|
| Customer Lifetime Value (CLV) | Total revenue a customer generates over their entire relationship with a brand. | A core profitability metric used to determine how much can be spent on acquisition. Higher CLV supports higher sustainable marketing spend. |
| Churn Rate | Percentage of customers who do not return or stop purchasing over a given period. | High churn indicates weak retention or poor post-purchase experience. Reducing churn is often more cost-effective than acquiring new customers. |
| Net Promoter Score (NPS) | Measures customer satisfaction and likelihood to recommend the brand to others. | Indicates customer loyalty and word-of-mouth potential. Higher NPS generally correlates with stronger retention and organic growth. |
If you want to dive deeper into metrics to prioritize by growth stage, read our ecommerce KPIs guide.
The eCommerce Analytics Stack: 4 Layers Explained
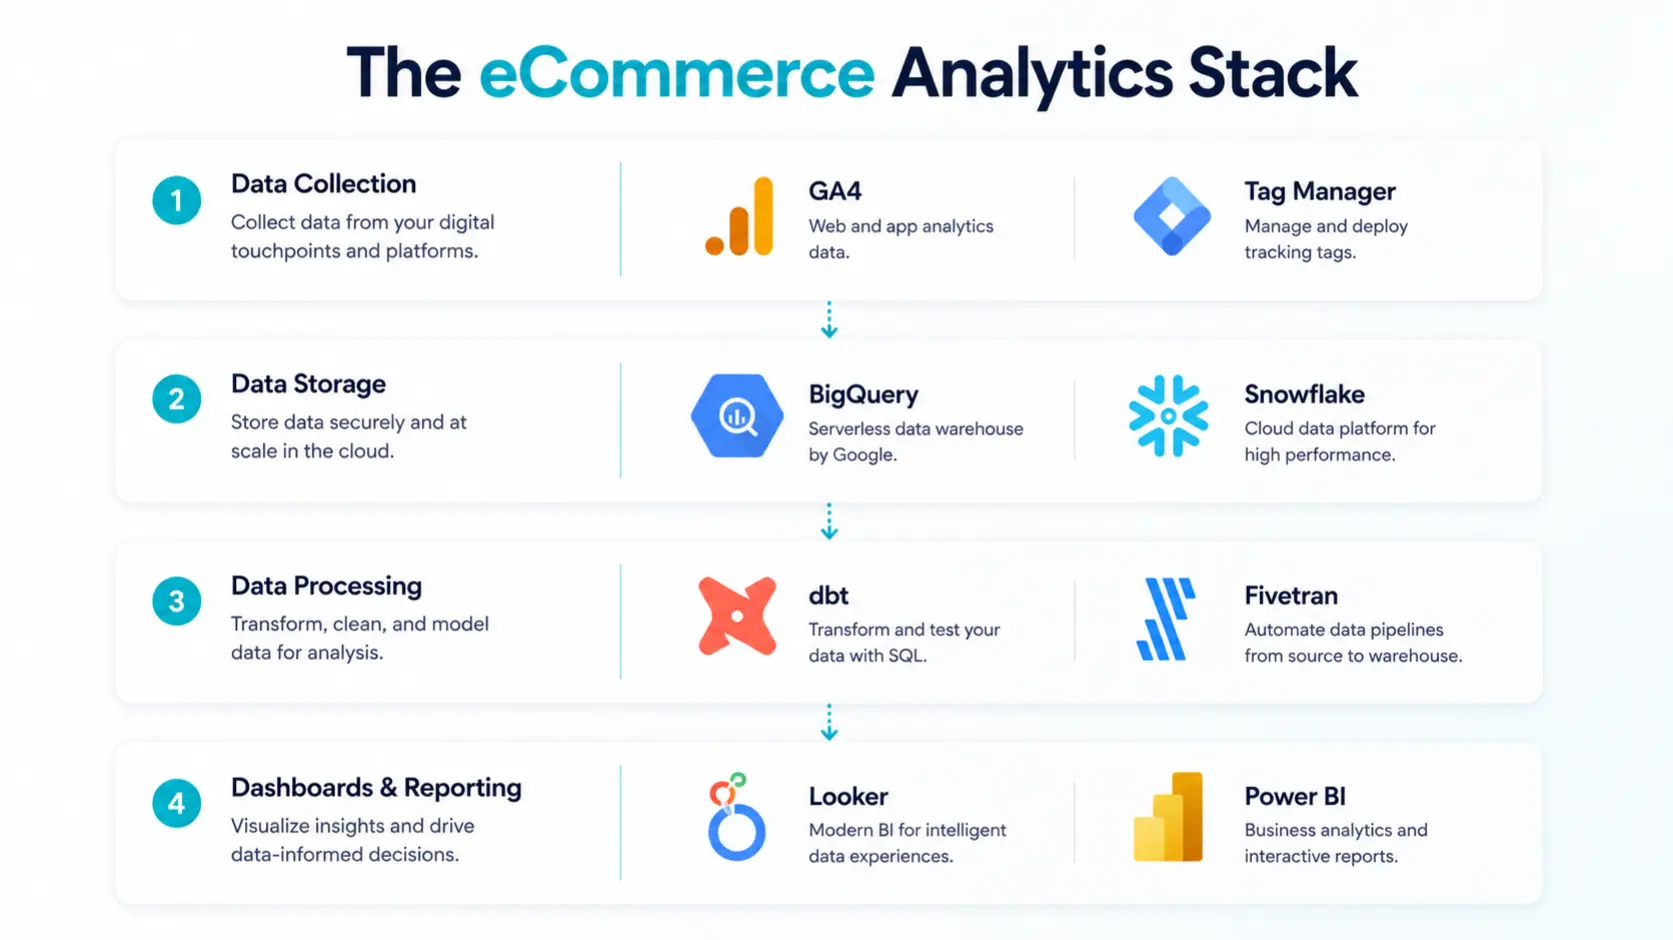
A sophisticated ecommerce analytics software framework is not just one single program, and it is a multi-layered framework that performs various tasks:
- Data Collection Layer: Page views, clicks, purchases, and form fills. Platforms: Google Tag Manager, segment, Rudderstack.
- Data Storage Layer: aggregates data from your store, CRM, ads, and logistics in one place. Tools: BigQuery, Snowflake, Redshift.
- Data Processing & Transformation Layer: Cleans, joins, and models data into usable datasets. Tools: dbt, Fivetran, Airbyte.
- Visualization & Reporting Layer: Converts processed data into the daily retailer’s dashboard. Learning Targets: Create and modify dashboards using tools like Looker, Tableau, Power BI, and Google Looker Studio.
This architecture will provide a reliable, scalable, and vendor-independent analytics. Combined with a customer data platform, it brings behavioral unification across channels.
Top eCommerce Analytics Tools & Software (2026)
The best ecommerce analytics tools depend on your team’s technical expertise, budget, and stage of growth. Compare some top options:
| Tool | Best For | Strengths | Pricing |
|---|---|---|---|
| Google Analytics 4 (GA4) | All store sizes | Free ecommerce tracking, funnel analysis, event-based reporting | Free |
| ProactiveAI | Ecommerce brands, business teams, and enterprise retailers | AI-powered analytics, natural-language queries, predictive forecasting, ecommerce dashboards, and self-service insights. | Custom pricing |
| Shopify Analytics | Shopify merchants | Native sales data, cohort reports, channel performance insights | Included |
| Klaviyo | Email-driven stores | Revenue attribution, predictive CLV, customer segmentation | Usage-based |
| Triple Whale | Meta/Google DTC brands | Multi-touch attribution, ROAS by channel, pixel-level tracking | From $129/month |
| Glew.io | Mid-market retailers | Product and customer profitability insights, multi-store analytics | From $79/month |
| Looker / Looker Studio | Data-mature teams | Custom dashboards, SQL-based analytics, integrates with data warehouses | Free Enterprise |
| Heap / Mixpanel | Product & UX teams | Auto-capture events, funnel analysis, conversion, and behavioral analytics | Freemium |
Marketplace operators and multi-vendor platforms should also be mindful of how their order management and product information management systems support clean, consistent information across these layers of analysis. Data hygiene begins at the product catalog and order record level: Garbage in, garbage out.
Building a Retail Analytics Dashboard That Works
A retail analytics dashboard isn’t useful unless people use it to take action. Most dashboards fail not because of the tool, but because of design. The steps to creating one that will make people take action:
Dashboard Design Principles
- One page, one purpose. A revenue dashboard ≠, a marketing dashboard. Different perspectives for different groups.
- Don’t lead with averages, lead with anomalies. Emphasize metrics that are not on trend, and these are the ones that deserve attention.
- Always show context. It’s just $52K without a WoW and MoM comparison.
- Attach each chart to a decision. If a chart is not an action, then delete it.
The 5-Section eCommerce Dashboard Structure
- Revenue Overview: GMV, orders, AOV tracking, and refund rate daily/weekly/monthly view.
- Acquisition Funnel: Sessions → PDPs → Add to Cart → Checkout → Purchase, with drop-off % at each step.
- Conversion Analytics: CVR by device, traffic source, landing page, and product category.
- Customer Health: New vs. returning split, CLV trend, churn cohort, NPS score.
- Marketing Attribution: Revenue by channel, ROAS, CPA, and assisted conversions. Check with cross-referencing and attribution models for accuracy.
Best Practices for eCommerce Performance Analytics
Disciplined processes are essential for even the best analytics platform to function. These practices are what set data-driven leaders apart from data-rich laggards:
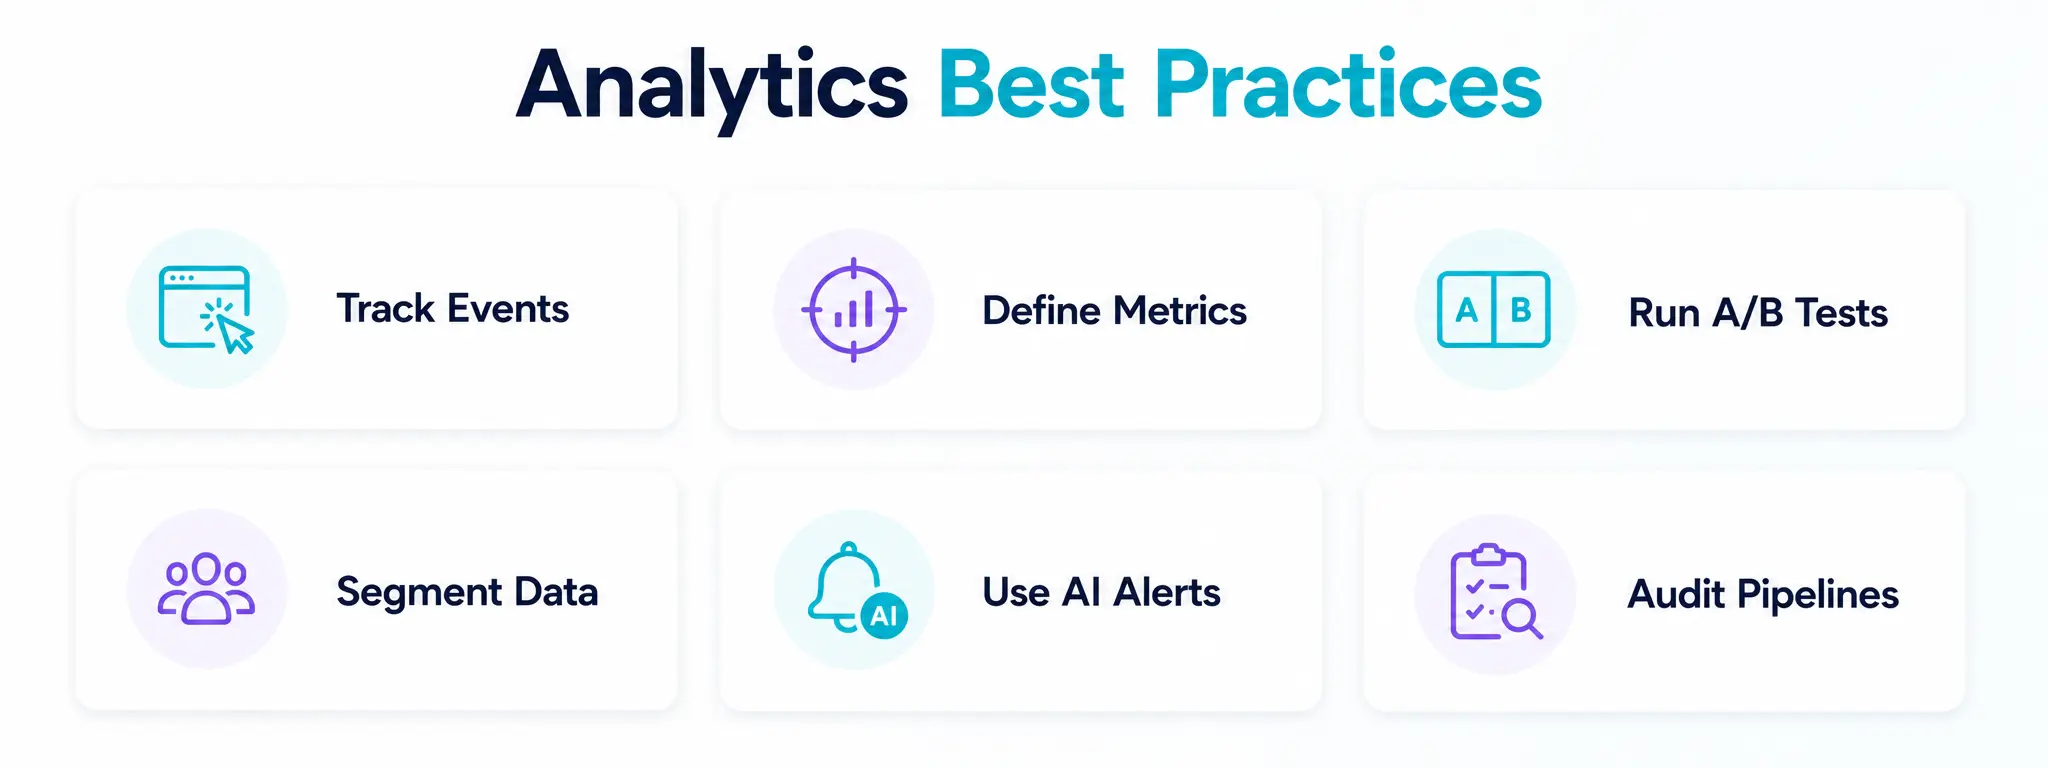
1. Strictly monitor event tracking
Track all valuable interactions with the product, such as views, wishlist additions, checkout stages, and post-purchase survey responses.
2. Establish metrics first, then create dashboards
Agree on definitions company-wide. Does conversion rate refer to site-wide or PDP-to-purchase? Consistency prevents misalignment.
3. Conduct A/B tests with statistical significance
Don’t send a layout change without measuring its effect on conversion analytics. VWO or Google Optimize are tools that natively integrate with GA4.
4. Segment ruthlessly
The truth is hidden by aggregate data. Analyze by device type, traffic source, geography, cohort, and customer tier independently.
5. Use AI to detect anomalies
AI in Retail now generates predictive signals, such as identifying unusual churn patterns, spikes in demand, or pricing anomalies before they are detected by humans.
6. Conduct data pipeline audits every quarter.
View tags break and API’s change. Silent data corruption is prevented with a quarterly health check.
How to Choose the Right eCommerce Analytics Approach?
There is no one “best” analytics setup. The selection should be based on three criteria: data maturity, team capability, and growth stage.
| Growth Stage | Recommended Stack | Priority Metric |
|---|---|---|
| 0–$1M ARR | GA4 + Platform-native analytics | Conversion Rate, CAC |
| $1M–$10M ARR | GA4 + Klaviyo + Triple Whale | AOV tracking, CLV, ROAS |
| $10M–$50M ARR | Connecting to Warehouse (BigQuery) with dbt and Looker | Cohort LTV, attribution accuracy |
| $50M+ ARR / Marketplace | Full CDP + Custom BI + AI layer | Vendor performance, buyer LTV, GMV margin |
For marketplace operators, the complexity of analytics is multiplied because you have to monitor buyer behavior, seller performance, catalog health, and logistics all at once. Your ecommerce growth strategy requires analytics built into your platform, rather than as an add-on.
Why SpxCommerce is the Center for your eCommerce Business Analytics?
Most marketplace platforms consider analytics a secondary concern. Unlike other marketplace development platforms, SpxCommerce develops them differently, with analytics integrated into every aspect of the architecture and the central focus.
We offer real-time dashboards to monitor GMV, vendor performance, buyer behavior, and fulfillment metrics in a single control panel, without requiring third-party BI tools.
Structured data flows seamlessly into analytics through native order management system (OMS) and PIM integrations, enhancing data quality at the source.
Our built-in intelligence layer detects predictive signals for inventory pricing and buyer intent with AI-powered demand forecasting. If B2B or B2C analytics can easily fit into complex account hierarchies and workflows.
All events are recorded in an attribution-ready architecture that allows for tracking funnel stages and multi-touch attribution out of the box.
We are a growth infrastructure, a combination of ecommerce marketing strategy support, data-first design, and marketplace tools for evidence-driven decisions across operations intelligently.
Conclusion
eCommerce analytics doesn’t have to be exclusive to enterprise retailers with data science teams. It is the minimum competitive requirement in 2026. Whether it’s high or low traffic or a high or low marketing budget, stores that know their conversion analytics inside and out, track AOV religiously, and operate from clean retail analytics dashboards beat the crap out of the rest.
What is clear is that you need to establish your metrics, structure your analytics stack according to your growth stage, instrument your data collection correctly, and make your dashboards decision-ready, not just pretty. As your marketplace grows, make sure that your platform, such as SpxCommerce, is built to support ecommerce data analytics, rather than adding on.
The brands that are winning in ecommerce are not the ones that are spending the most. They are the ones learning the fastest. Analytics is the way to make faster learning than your competitors.