
You split the monolith to make your system more scalable, flexible, and easier to evolve. So why can some operations take longer?
Instead of calling functions directly within one application, your system relies on network calls between services, distributed databases, queues, caches, and third-party APIs. Several services could sit between a user’s request and the browser’s response. A single slow dependency can cause “milliseconds that matter”.
The issue typically isn’t microservices. It’s how the architecture is designed and how these services communicate, access data, fail gracefully, and scale with load.
Here’s a rundown of some of the most prevalent microservices performance issues that you’ll encounter, ranging from N+1 queries, poor caching, connection pool problems, database bottlenecks, to excessive service-to-service calls and synchronous bottlenecks. But above all, we’ll help you understand what is really slowing you down and which optimizations will actually help.
The trick to distributed systems is that simply scaling out on more servers isn’t always the solution when they’re slow. First, you need to find out where the time is going.
Why Is Microservices Performance Optimization Necessary?
Microservices give teams the flexibility to deploy and scale individual services more flexibly. Those advantages, though, come with an additional performance burden. Each network request, database operation, serialization operation, and dependency on external services introduces latency and the possibility of failure.
The more services you add, the more potential inefficiencies can add up. One user request could be routed through five or ten services to get a response. Even a minor service delay can significantly impact the overall response time.
Teams can benefit from performance optimization by:
- Minimizing latency between service-to-service communication.
- Avoiding bottlenecks in the database and connection.
- Coping with heavy loads without cascading failures.
- Efficiently using resources/infrastructure costs.
- Providing consistent response times as the system grows.
It’s important to optimize the entire request path, not each service. Distributed tracing, metrics, load testing, and profiling can help identify where time is actually being spent, so teams can fix the bottlenecks with the greatest impact.
Microservices vs. Monolith: Where Performance Actually Diverges
For a monolith, a function call is a function call. It does not occur over the network or even within the network. If you break the monolith into services, each equivalent call traverses a network boundary. This is the basic performance compromise.
| Dimension | Monolith | Microservices |
|---|---|---|
| Inter-service calls | In-memory, ~nanoseconds | Network hop: 1–100ms for each hop |
| Data consistency | A consistency model of one DB, with the consistency type of ACID, defaulted. | Distributed eventually consistent problems |
| Scaling | Scale the whole app | Scale services one-by-one |
| Failure isolation | As soon as one fails, it takes everything down with it | Failing = Stay within service boundaries |
| Deployment speed | Redeploy the entire app per change. | Deploy services independently |
| Observability | Simpler one codebase to follow. | Needs distributed tracing in services |
This means that microservices offer advantages in flexibility and fault isolation. The goal is to reduce network overhead without losing the architecture’s benefits. Optimization is all about reducing that loss without losing the benefits of the architecture.
What Are the Most Common Microservices Performance Issues?
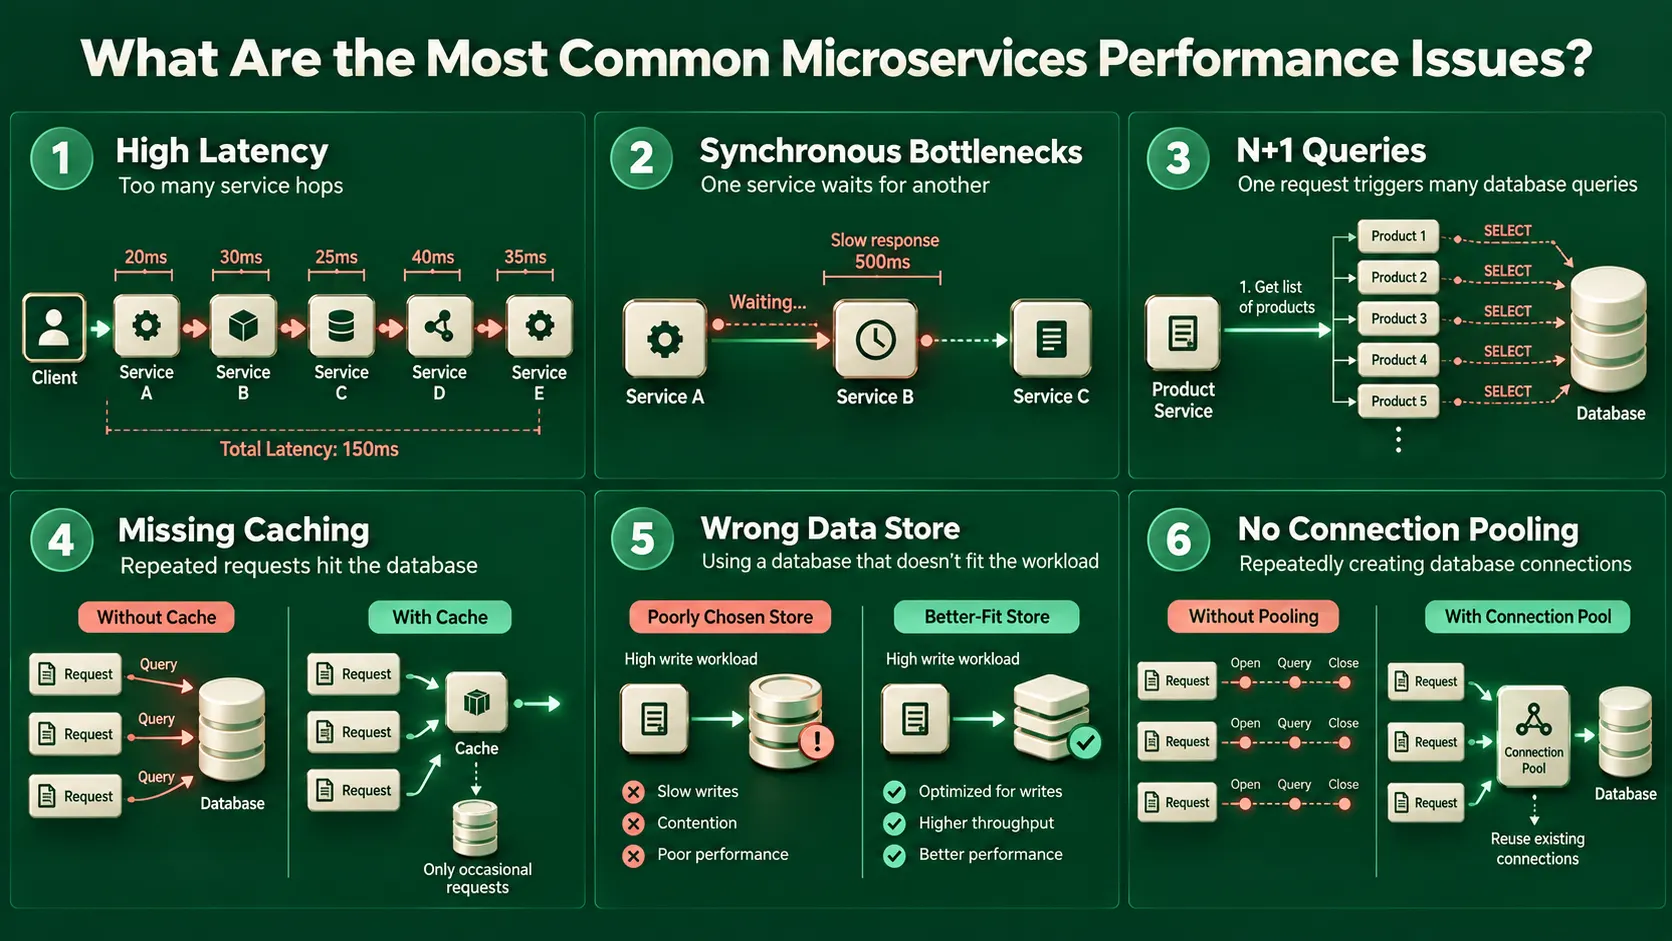
Lots of easy-to-miss problems can add up and cause performance bottlenecks, such as too many service calls, inefficient database queries, improper caching, and so on. Identifying these issues early can help teams reduce latency, increase reliability, and scale more efficiently.
Issue #1 – High Latency from Excessive Service Hops
The granularity of the architectures may be excessive, with services communicating with many other services to handle a single request. Each hop adds latency, and a chain of 10 services can introduce significant overhead before the user receives a response. One of the most prevalent microservices performance problems teams face after migration.
Issue #2 – Synchronous Calls Creating Bottlenecks
If Service A waits for Service B to respond before proceeding, you’ve created a synchronous chain. If B is slow or unavailable, A may have to wait until a timeout or fallback mechanism takes effect. This quickly shows up as system slowdown in high-traffic environments.
Issue #3 – N+1 Query Problems with ORM Frameworks
Some ORMs like Hibernate can produce unoptimized queries that access the database one per object, rather than one per collection. N+1 problems compound rapidly when each service has its own DB in a microservices architecture.
Issue #4 – Missing or Misused Caching
Without an appropriate caching strategy, frequently requested data may trigger unnecessary database queries. A query that takes 10ms to process but runs thousands of times per second becomes a bottleneck. Too little, too late, or at the wrong level.
Issue #5 – Poorly Chosen Data Stores
If your application handles high-volume, unstructured event data, a relational database may not be the best fit for that workload. The DB is the limiting factor on that service’s performance, and you can’t scale out a schema issue.
Issue #6 – No Connection Pooling
Creating and closing a database connection for each request can add substantial overhead under high load. A problem often overlooked is that services that don’t pool connections spend more time handling connections than performing actual work.
Which Microservices Performance Optimization Techniques Actually Work?
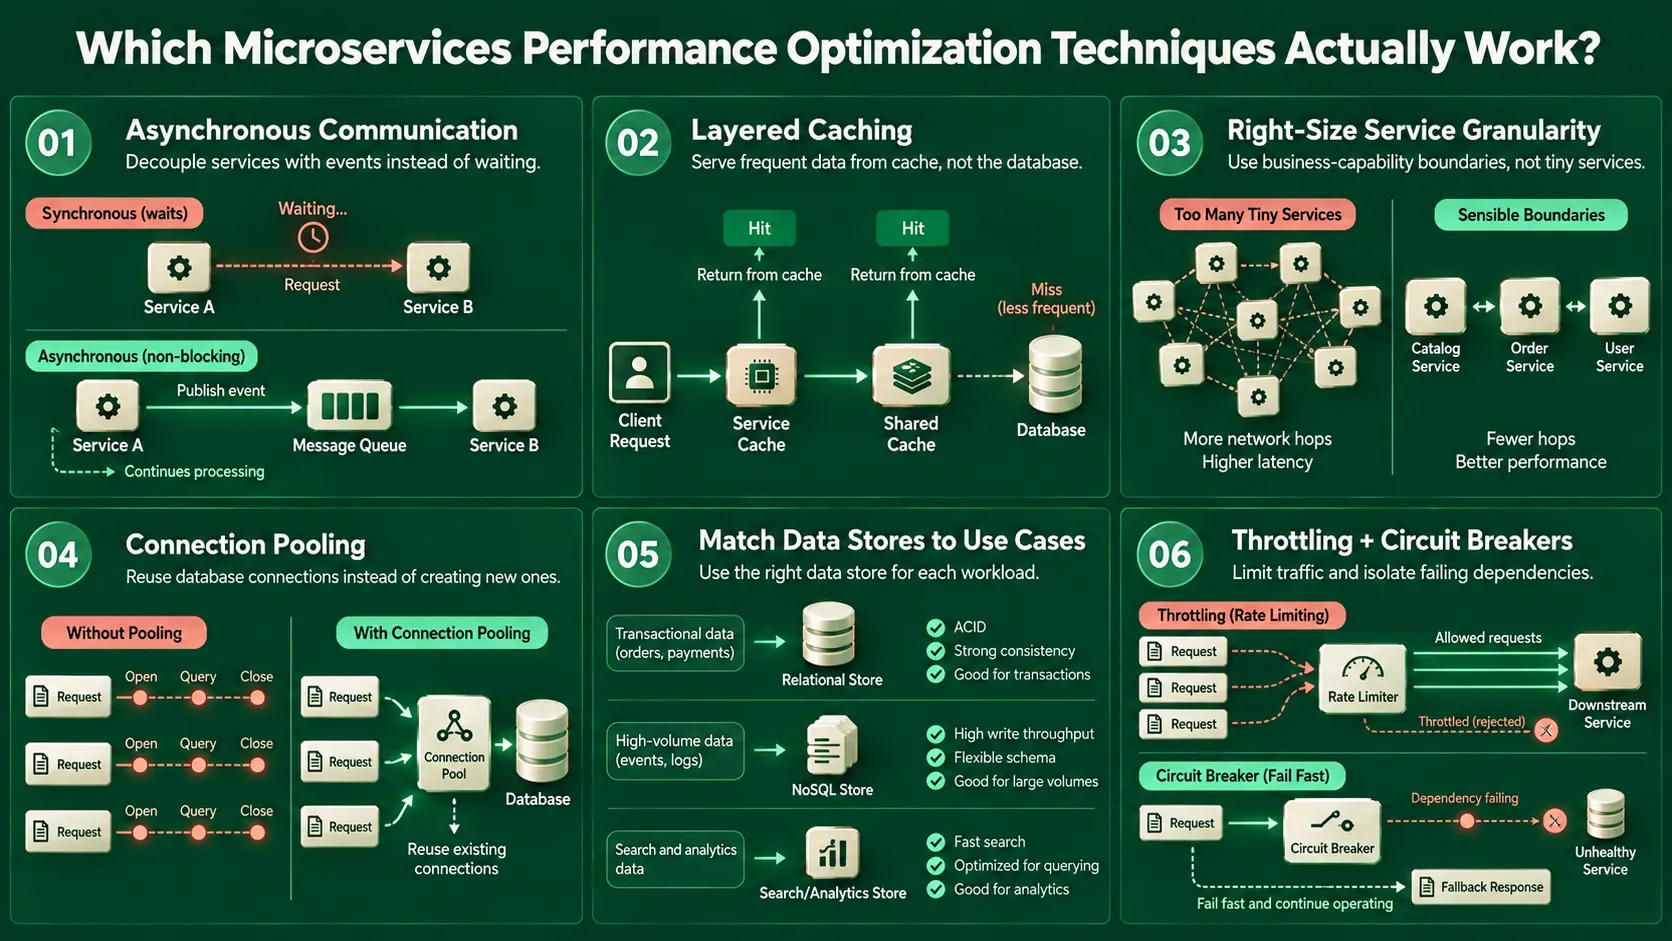
The best optimization strategy depends on where performance is slow, but the fundamentals are to minimize unnecessary network calls, optimize data access, and use caching and asynchronous communication effectively. The secret is to optimize based on performance measurements, not for all services, but in that particular service.
1. Switch to Asynchronous Communication Where You Can
Use message queues for operations that don’t require an immediate response, such as order processing, sending notifications, and log ingestion. Services can send events and then continue without waiting for a response with tools such as Apache Kafka, RabbitMQ, and AWS SQS. The receiving service operates at its own pace. In data-intensive workflows, this simple adjustment can reduce average response time by 30-60%.
Watch the antipattern: adding a message queue between two services does not solve a slow service, and it just pushes the problem into the queue. The downstream service will not be able to catch up with the queue, and instead of timeouts, you will get backpressure failures. First, correct the slow service, then add the queue to a separate service.
2. Layer Your Caching Strategy
There are three levels of effective caching. Each microservice has its own microservice cache (Redis or Memcached) for the most commonly read data in the service. A shared cache on a distributed level means that for shared data sets, no duplicate DB calls are made. HTTP cache headers like Cache-Control and ETag let clients avoid requests for static or slowly changing responses. Services such as AWS ElastiCache can support distributed caching strategies that reduce repeated database requests and improve response times.
3. Right-Size Your Service Granularity
Very granular services increase network overhead but reduce coupling. Coarse-grained services reduce hops but reduce independent scaling. Balance is achieved by applying Domain-Driven Design: create service boundaries around business capabilities rather than technical layers. Two services that always communicate to perform a single user action could be grouped together.
4. Implement Connection Pooling
A connection pool is similar to a pool of open connections, and services reuse them rather than opening and closing a DB connection for each request. For Java microservices, the best choice is HikariCP, which is consistently the fastest JDBC connection pool on the market! Other stacks have similar pooling libraries. With this optimization alone, DB latency can be reduced by 20-40% under load.
5. Match Data Stores to Use Cases
When ACID transactions are required, relational databases like PostgreSQL and MySQL are the best fit. NoSQL solutions such as MongoDB, Cassandra, or DynamoDB are better suited for high-throughput writes, unstructured data, or time-series writes. Unfortunately, the performance-limiting factor for a service is often simply the wrong database, and you can’t solve a schema issue by deploying more instances of the same service.
6. Use Throttling and Circuit Breakers
Rate limiting prevents a high-traffic service from overwhelming downstream services. Circuit breakers prevent repeated calls to failing dependencies, giving the system time to recover while allowing applications to return errors or fallback responses. You can apply these patterns at the infrastructure level, without modifying application code, via service meshes such as Istio or Linkerd.
How to Find the Actual Microservices Bottleneck
If you don’t see the problem, you can’t fix it. Latency in a distributed system may come from application code, database operations, service-to-service calls, external APIs, or infrastructure. The first thing you need to do is to figure out where the time is going.
1. Distributed Tracing → OpenTelemetry / Jaeger
Distributed tracing tracks a request through all the services it encounters, and reveals the duration of each operation. The teams can identify slow service calls, slow database operations, or unanticipated dependencies along the request path using tools such as OpenTelemetry and Jaeger.
2. Metrics → Prometheus / Grafana
Metrics provide a more comprehensive view of the system’s health and performance. Monitor p95/p99 latency, request rate, error rates, CPU and memory usage, number of database connections, and queue depth. Prometheus can collect these metrics, while Grafana can visualize them through dashboards and trigger alerts when defined thresholds are exceeded.
3. Profiling → Application Profilers
Tracing identifies the slowest service, whereas profiling answers the “why?” Application Profilers can show CPU usage, memory allocation problems, poor algorithms, thread contention, and other code-level issues within a service.
4. Load Testing → k6 / Locust
A service that performs well under light traffic can behave very differently under production-level load. K6 and Locust help teams mimic realistic traffic and pinpoint bottlenecks before they impact users. Measure p95 and p99 latency, throughput, error rates, resource utilization, and database performance.
5. Start With the Request Path
The best way to do this is to use a genuine request, from start to finish.
Client → API Gateway → Service A → Service B → Database → External API
When you know where latency occurs, you can focus on optimizing that point rather than guessing which service needs improvement.
How to Scale Microservices Without Creating New Performance Bottlenecks?
Scaling isn’t simply about adding more instances. Increasing the number of application servers can have little impact if the problem is a slow database, too many service-to-service calls, or overloaded dependencies.
It is more effective to first identify the constraint, then scale the component that is actually limiting throughput.
1. Scale For The Right Metrics
Don’t rely on CPU and memory alone. Track request rates, p95/p99 latency, error rates, database connections, queue depths, and throughput to identify when and where scaling is required.
2. Load Test Before Traffic Spikes
In production, traffic can surface problems that won’t show up during regular testing. To simulate more realistic workloads and learn how services behave with increased traffic, use tools like k6 or Locust.
3. Instrument Before You Optimize
Before making any significant changes to an application’s performance, a distributed tracing system and application metrics should already be in place. They can help you set a baseline, pinpoint bottlenecks, and check whether an optimization improved the system.
Protect External Dependencies
Third-party APIs, payment gateways, authentication providers, and other external services can be performance bottlenecks. Configure timeouts, connections, rate limits, caching, and circuit breakers so that a slow dependency won’t slow down your service.
Scale the Bottleneck, Not Everything
Workloads are seldom similar for different services. You might need more search instances during a traffic surge, but payment processing may not change much. One of the best things about microservices is the ability to scale independently, leveraging the actual workload pattern rather than scaling all services at the same time.
The goal isn’t to make every service faster. It is to make the entire request path quicker, more predictable, and less dependent on load.
How Do You Choose the Right Optimization Approach?
Not all systems require all optimizations, however. The appropriate starting point will depend on what is slow:
| Symptom | Most Likely Cause | First Step |
|---|---|---|
| High average response time. | Many Synchronous service hops. | Install distributed tracing; figure out the longest call chain. |
| During load, DB timeouts have occurred. | The absence of connection pooling / N+1 queries. | Add connection pooling; examine ORM fetch strategies. |
| Traffic is spiked and service crashes. | No auto-scaling / wrong data store. | Define HPA policies in Kubernetes; evaluate DB fit |
| Failing services cascading across each other. | No retry limits or circuit breakers. | Use Resilience4j or Istio circuit breaking. |
| Repeated reads hitting DB. | Missing caching layer | Install Redis at service level, and check cache TTL strategy |
How SpxCommerce Handles Performance at Scale?
With many merchants offering different products on the same platform, the eCommerce system needs to support high traffic, frequent catalog updates, product changes, payments, and notifications without compromising the customer experience. SpxCommerce takes a microservices-first approach to decoupling these workloads, enabling individual microservices to scale independently.
We allow core marketplace functions like vendor management, catalog management, order processing, payments, and notifications to run as standalone services. This separation limits the impact of changes or traffic spikes in one function on other critical services. For instance, sellers can update the catalog in the background without impacting checkout, and notification workflows can be processed asynchronously during peak traffic periods.
Caching and scalable service architecture can also help to minimize unnecessary database and service-to-service calls, ensuring a fast marketplace experience as demand rises.
SpxCommerce offers an architecture that supports scalable, resilient operations for a multi-vendor marketplace, ideal for businesses seeking a solution to handle sudden traffic surges, product launches, or growth.
Conclusion
While the advantages of microservices can include scalability, flexibility, and fault isolation, those gains do not just happen. A distributed architecture can be a nightmare to operate if services are poorly designed, too many network calls are made, inefficient queries are issued against databases, the required data is not cached, connections are bottlenecked, and a weak failure-handling strategy is used.
The best way is to measure, then optimize. Identify where latency and resource consumption are actually coming from through distributed tracing, metrics, profiling, and load testing. Then solve the bottleneck with the right solution, which could range from reducing service hops to optimizing DB access, adding caching, implementing asynchronous communication, tuning connection pools, or adding timeouts and circuit breakers to protect dependencies.
In addition, performance on high-volume platforms, such as multi-vendor marketplaces, depends on services’ ability to scale independently and handle traffic surges without impacting critical customer journeys.
Finally, optimizing microservice performance isn’t about making all services faster. It’s about creating an architecture that remains speedy, predictable, scalable, and resilient as demand increases.