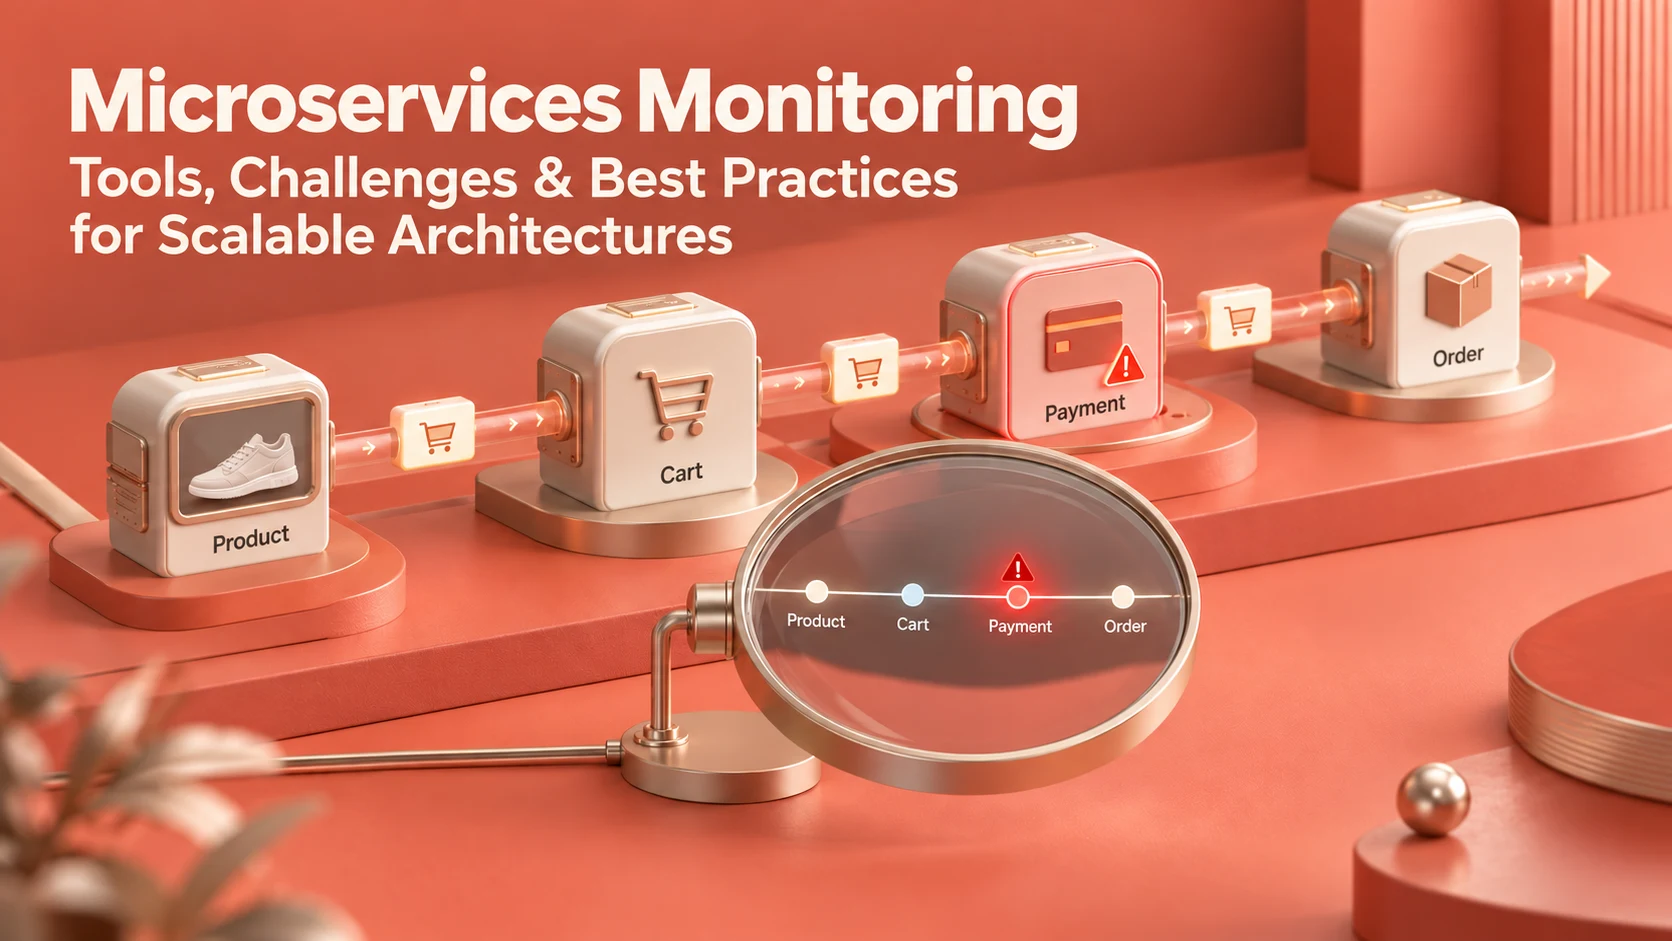
Your users are pushing “Place order,” and they don’t get anything. A checkout request times out. Meanwhile, three engineers spend hours investigating a latency issue across services, only to find it originated in two upstream services.
Sound familiar?
This is one of the largest challenges of running a modern microservices architecture. Tracing requests, dependencies, and failures across dozens of independent services is more complex than diagnosing issues in a monolithic application. A minor issue in one service can cascade into failures across dependent services and user-facing workflows.
This is where microservices monitoring comes into play.
Implementing an observability program can help teams gain visibility into what is occurring across the entire architecture, uncover bottlenecks faster, understand the root cause of a failure, and resolve an incident before it impacts customers or revenue.
In this guide, we’ll dive into what microservices monitoring is, why it is important, the problems teams encounter, the top monitoring tools in the market, and best practices for creating a scalable and reliable monitoring strategy, particularly for ecommerce and marketplace sites.
What Is Microservices Monitoring?
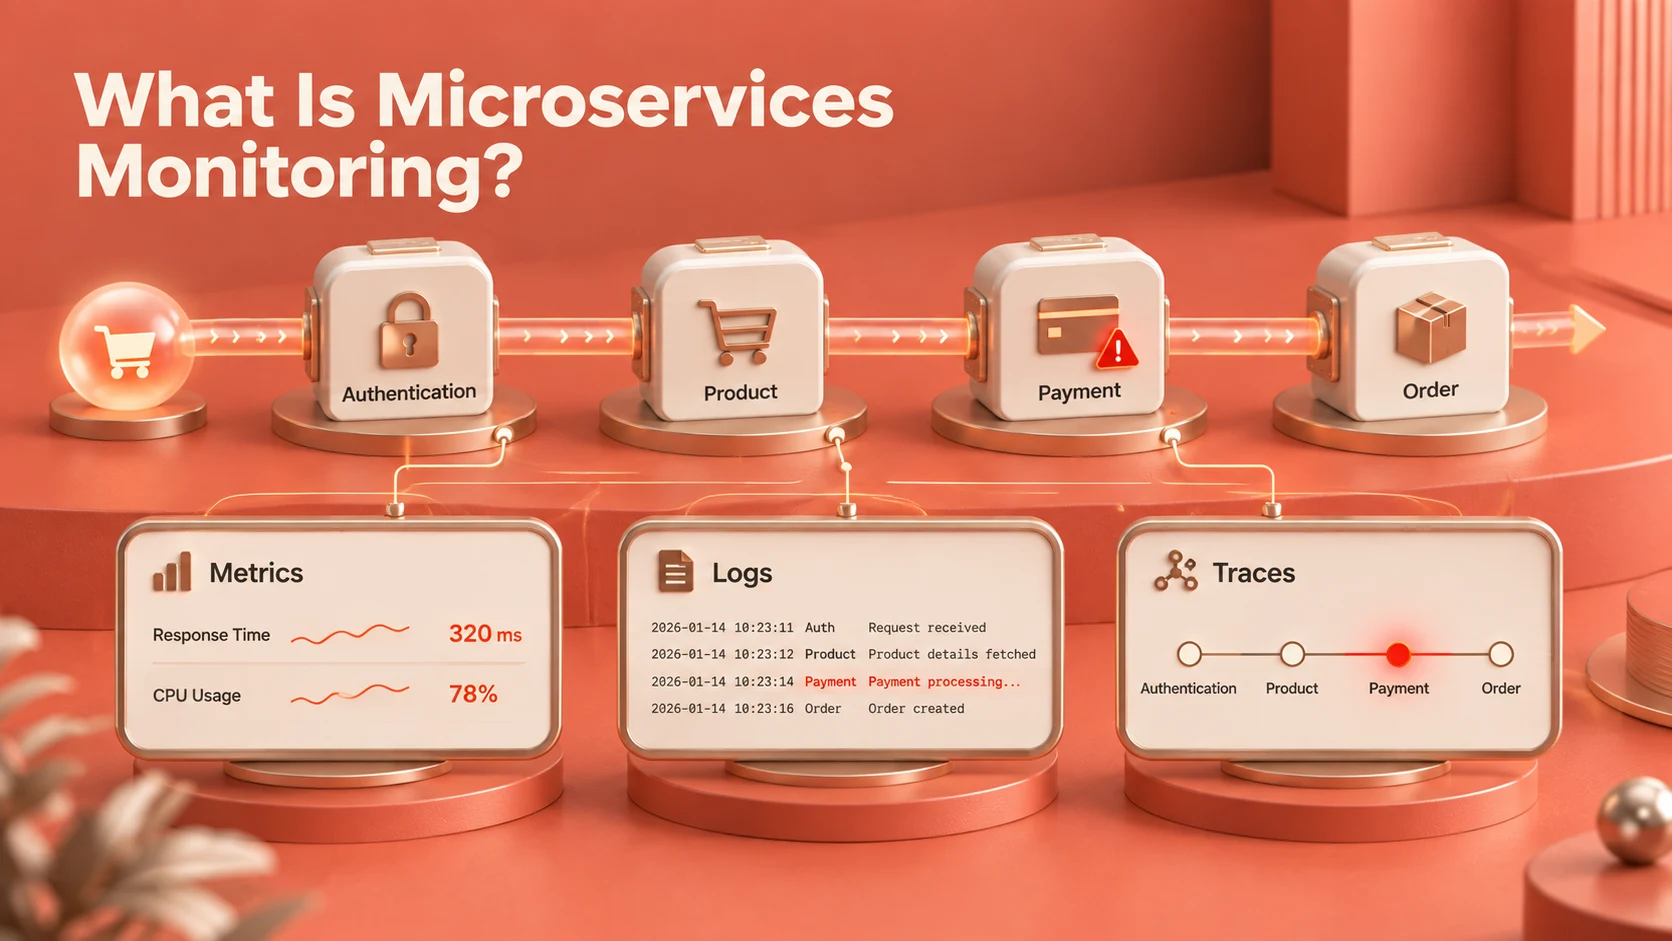
Monitoring microservices involves continuously collecting, analyzing, and acting on data from each service in a distributed application. Imagine putting sensors all over a massive factory, with each sensor sending its own health, speed, and error data back to a central console. The objective is to have a real-time view of everything happening across the entire system.
For a typical microservices architecture, you will have services such as authentication, product catalog, payment, shipping, notifications, and so on. They are independent in how they run, scale, and fail. Monitoring becomes a thread and helps you answer the question all engineering teams dread: “Where did the request actually break”?
According to the CNCF Annual Survey 2024, 91% of respondents reported using containers in production, demonstrating the widespread adoption of cloud-native architectures that require distributed-system observability.
There are three data types to monitor: metrics (numerical data over time, such as response time and CPU usage), logs (record of events in a service over time, with timestamps), and traces (the end-to-end journey of a request through services, with timestamps). Together, metrics, logs, and traces are commonly known as the three pillars of observability.
Why Does Monitoring Matter for Distributed Systems?
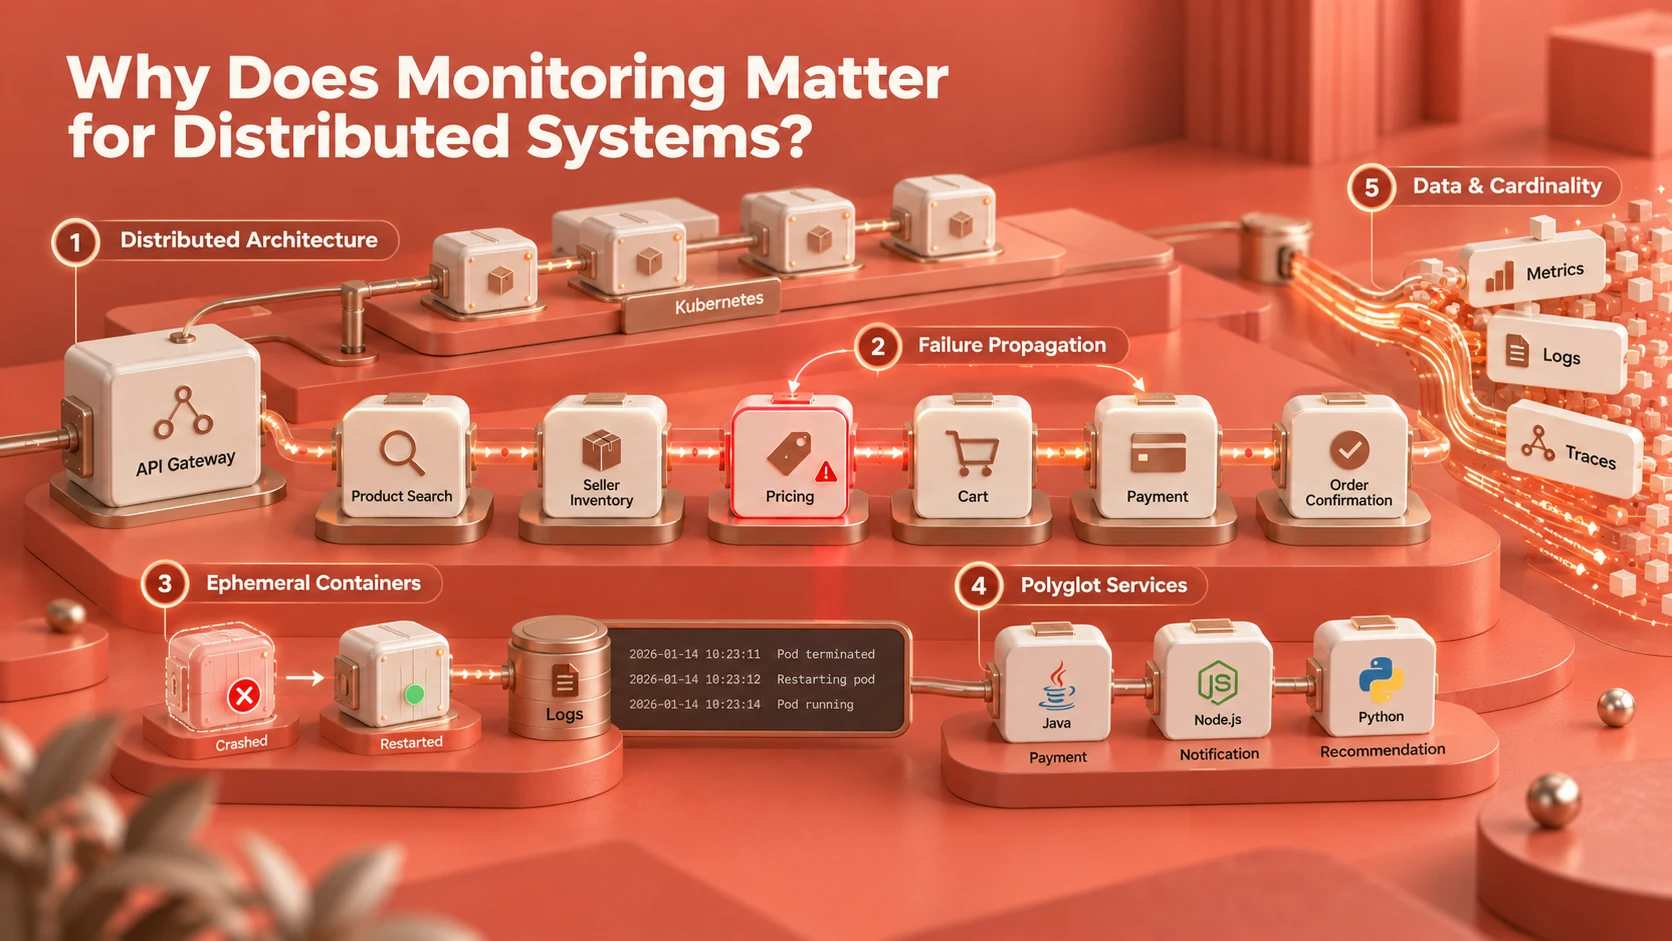
Monolithic applications can centralize functionality, which often makes failures easier to isolate than in distributed microservices architectures. With microservices, if one dependency service is slow, the query can silently propagate through the system, causing your user-facing platform to degrade without a single point of failure.
This is particularly important on marketplace platforms, where several services must run in harmony like product search, seller inventory, pricing engine, cart, payment gateway, order confirmation, etc. If the pricing engine has a 300ms delay, 20% of users may not see it as an alert, but if it adds up with the other 2 services, 20% of users may abort checkout.
To solve a problem, you must first know what you’re dealing with. These are typical problems engineering teams encounter, and many aren’t found until after you go into production.
1. Distributed Architecture Complexity
With a monolith, the only agent on a host sees everything. For microservices, particularly in a Kubernetes cluster, services are deployed in ephemeral containers. Infrastructure agents can monitor Kubernetes resources without application instrumentation, while deeper application telemetry requires instrumentation within individual services. On top of that, introducing service meshes, load balancers, and API gateways rapidly expands the observability surface area.
2. Service-to-Service Failure Propagation
If one service fails, it won’t stay that way. If one authentication service slows down, so do all the services that depend on it. The only apparent symptom is that the user-facing checkout service slows down, which is two steps away. Without a trace of the whole chain, engineers will spend hours debugging the wrong service.
3. Ephemeral Containers and Pod Crashes
A container crashes in Kubernetes, and it comes back up rapidly, and that’s awesome for uptime, but terrible for debugging. Without centralized log collection and appropriate retention, container logs can become difficult to access or may be lost after restarts and rescheduling.
4. Polyglot Environments
Teams of modern microservices developers typically develop their microservices in different languages, such as Java for the payment service, Node.js for the notification service, and Python for the recommendation service. The performance characteristics, instrumentation libraries, and logging formats vary from runtime to runtime. It’s a huge operational challenge to keep monitoring coverage consistent on all of them.
5. Data Volume and Cardinality
If you produce metrics, logs, and traces for a 50-service system at any meaningful scale, you are creating a lot of telemetry data. Time-series databases suffer from high cardinality, meaning there can be thousands of unique label combinations across metrics. High cardinality (thousands or millions of different label combinations in the metrics) increases storage costs and query latency. Monitoring infrastructure is a scaling problem without sampling strategies or retention policies.
Which Microservices Monitoring Tools Should You Use?
There are many tools available. Let’s make an honest comparison of the most popular choices on the three pillars.
| Tool | Category | Best For | Pricing Model |
|---|---|---|---|
| Prometheus + Grafana | Metrics + Dashboards | Open-source, Kubernetes-native teams | Free (self-hosted) |
| Datadog | Full-stack APM | Enterprise, multi-cloud, unified view | Usage-based SaaS |
| Jaeger / Zipkin | Distributed Tracing | Open-source trace collection | Free (self-hosted) |
| OpenTelemetry | Instrumentation Standard | Vendor-neutral telemetry collection | Free (CNCF project) |
| Elastic Stack (ELK) | Logs + Search | High-volume log aggregation and search | Free tier + paid |
| New Relic | APM + Logs + Traces | Unified observability with AI alerting | Free tier + usage-based |
| Dynatrace | Full-stack AI monitoring | Automated root cause analysis | Usage-based SaaS |
| AWS X-Ray | Distributed Tracing | AWS-native service architectures | Pay-per-trace |
What’s the Role of OpenTelemetry?
OpenTelemetry has emerged as a widely adopted standard for vendor-neutral observability instrumentation. It’s a CNCF-maintained project that offers SDKs and APIs for all major languages, so you can instrument your services once and export telemetry to any supported backend, such as Datadog, Jaeger, Prometheus, or your own system.
This eliminates the need for vendor lock-in at the instrumentation level, which is important: OpenTelemetry can reduce instrumentation-level vendor lock-in by allowing teams to change supported backends without rewriting service instrumentation.
What Are the Microservices Monitoring Best Practices?
It’s one thing to have tools. Using them effectively is yet another. That’s what they do, and that’s what separates engineering teams that monitor reactively from those that monitor proactively.
1. Use OpenTelemetry from the start and standardize instrumentation
Don’t instrument each service differently. Choose OpenTelemetry as your collection standard, and use your CI/CD pipeline to enforce it. Propagate consistent trace context across services and standardize log formats and metric naming conventions. This uniformity makes it possible to achieve correlation at scale.
2. Use structured logging across all services
A single developer may be fine with plain-text logs. For a distributed system, ensure that logs include a consistent set of JSON fields: timestamp, service_name, log_level, correlation_id, and message. Centralized search, alerting, and cross-service correlation are possible with tools such as Elasticsearch or Datadog Logs.
3. Use correlation IDs to connect logs, metrics, and traces
Each API call should have a unique correlation ID at your API gateway or ingress layer. Pass this ID down through all downstream services via HTTP headers or message queue metadata. Record the correlation or trace context in each relevant log and associate it with the corresponding trace and spans. Otherwise, cross-service debugging is a guess.
4. Implement health checks and readiness probes for every service
Use health checks that distinguish application liveness from dependency readiness, and avoid making liveness probes depend on external services. For each deployment, configure both liveness probes (to restart an unhealthy container) and readiness probes (to stop routing traffic to a container that is not yet ready) in Kubernetes.
5. Alert on error budgets, not just raw thresholds
An alert at “error rate > 1%” might seem like a prudent rule until you discover that it is firing every 30 minutes on a low-traffic endpoint. SLO-based alerting (alerting when your error budget is exceeded over a sliding window) is a great way to reduce alert fatigue and ensure you alert on true reliability regressions. Use multi-window burn rate alerts for any service with a defined SLO, alerting when the burn rate for 5 minutes or 1 hour exceeds the threshold.
6. Automate service discovery in your monitoring configuration
Services can be deleted or added in a dynamic Kubernetes environment. Make sure new services are automatically deployed and monitored using your monitoring tool’s service discovery integration: Prometheus has native Kubernetes SD support, and Datadog auto-discovers containers.
7. Ship container logs to centralized storage before the container exits
Install a sidecar logging agent (Fluentd, Fluent Bit, or Datadog agent) on all pods to forward logs in real time to your central logging system. If a container crashes, you will still receive its logs, even after Kubernetes has already restarted it.
8. Review and rotate your monitoring configuration quarterly
Services evolve. What seemed like reasonable alerts 6 months ago may be incorrect now. Conduct a quarterly review to audit metrics and alerts, eliminate noise, and include newly added services. If no one reads the monitoring setup, it becomes a burden.
How to Choose the Right Microservices Monitoring Solution?
There are dozens of tools to choose from, and when deciding, it’s not about features, as most of the more established ones will do the basics. It’s a matter of fitting your architecture, team, and operational model.
| Consideration | What to Evaluate |
|---|---|
| Architecture fit | Is the tool natively supported for Kubernetes? Does it auto-instrument your main languages? |
| Unified visibility | During an incident, can you correlate metrics, logs and traces in a single UI? Or do you need to switch between 3 tools? |
| Vendor lock-in risk | Can the instrumentation layer be replaced by OpenTelemetry, allowing for backends to be changed without re-instrumenting services? |
| Cost model | Usage-based pricing can catch you off guard at scale. Before signing a contract, estimate the log volume, trace count, and metric cardinality. |
| Team capability | Self-hosted Prometheus + Jaeger is powerful, but requires maintenance. Managed SaaS is a better value for smaller groups. |
| Alerting quality | Are alerts provided based on SLOs as well as thresholds? A lack of proper threshold setup is a productivity killer because alerts are being triggered. |
The most actionable feature for marketplace and ecommerce sites is the ability to follow a user session from their search to their cart, checkout, and purchase confirmation. Focus on tools that make it easy to query and visualize cross-service traces, not just collect them.
How Does SpxCommerce Handle Monitoring at Scale?
Manually tracking thousands of orders, integrations, and transactions becomes more challenging as your eCommerce business expands. Centralized, scalable monitoring is the solution SpxCommerce provides to meet this challenge and enable visibility across the entire commerce ecosystem, including multi-vendor marketplace platforms.
We monitor vital processes such as order management, inventory updates, payments, fulfillment, marketplace and ERP integrations, CRM integration, and more. Our automated alerts can notify teams of failures, delays, and abnormal activity before they become significant operational problems.
Additionally, SpxCommerce integrates monitoring data into a single view, monitors the system’s health, and helps troubleshoot across channels. Rather than gathering disconnected logs or performing manual checks, teams can quickly gain an overview of how the problem affected server performance and take corrective action.
As order volumes, integrations, and sales channels grow, SpxCommerce leverages automation, real-time visibility, and ProactiveAI-generated alerts to keep commerce operations running smoothly.
Conclusion
While microservices provide the scalability and flexibility needed in modern ecommerce and marketplace businesses, they also introduce significant operational complexity. Multiple services, integrations, containers, and dependencies collaborate, and monitoring is vital to reliability and a seamless customer experience.
A robust microservices monitoring approach leverages metrics, logs, and distributed traces to gain a full view of the application. Teams can resolve issues faster and catch them earlier by standardizing instrumentation with OpenTelemetry, employing structured logging, implementing health checks, enabling automated service discovery, and adopting SLO-based alerts.
For ecommerce businesses, monitoring should extend beyond infrastructure health to cover the critical workflows that drive revenue and customer experience. Teams must have access to key workflows such as orders, inventory, payments, fulfilment, and third-party integrations.
For these issues, some solutions provide visibility and centralized management, such as SPXCommerce, which alerts and flags potential issues before they cause significant operational problems.
In conclusion, effective monitoring helps teams shift from reactive troubleshooting to proactive reliability, ensuring businesses can scale with confidence, maintain performance, generate revenue, and sustain customer satisfaction.